EPQ Gantt Chart: How to Plan Your Project Week by Week
By Michael Thompson · Education Specialist; 10 years teaching the IB at Bromsgrove School · Published 24 October 2026 · Updated 25 October 2026
An EPQ Gantt chart is a horizontal bar chart that maps every project task against the weeks available - making it a central piece of evidence that you have managed the project, which is what AO1 (Manage) assesses. The catch is that the chart earns almost nothing on its own: the marks come from monitoring progress against it, recording when and why bars move, and referring to it in your evaluation and presentation. All four exam boards - AQA, Pearson Edexcel, Cambridge OCR and WJEC - share the same four assessment objectives, so the planning logic below applies regardless of which specification you are following. This guide walks through the phases your plan must cover, how to build the chart step by step, and how to turn it into genuine evidence rather than a one-off diagram you forget about.
Key Takeaways
- The chart is evidence of management, not management itself: Moderators and assessors want to see that you monitored your plan and recorded justified changes - a static chart filed at the start of your log is worth little.
- AO1 (Manage) is worth 20% of marks on AQA and OCR: On AQA 7993 that is 10 out of 50 marks; on OCR H857 it is 12 out of 60 marks - enough to shift your grade if the evidence is thin.
- Seven phases belong in every EPQ plan: Taught skills and topic choice, proposal and title approval, research, production or writing, review and redrafting, presentation preparation and delivery, and final evaluation and submission.
- Update your chart at least every fortnight: Each update should be recorded in your log - AQA's Production Log and Assessment Record, OCR's Project Progression Record (PPR), or Pearson's activity log - with a brief reason for any change.
- The three project routes need different bar shapes: Dissertations need long research and drafting bars; artefacts need development, testing, and photographic evidence stages; investigations need data-collection windows and ethics checks.
- Your centre's calendar, not a generic template, sets the real dates: The 30-week sample layout in this guide is written for illustration only - check your supervisor for your actual submission and presentation deadlines.
In This Article
- What an EPQ Gantt Chart Is and Why It Matters for AO1
- The Seven Phases Every EPQ Project Plan Needs
- How to Build Your EPQ Gantt Chart in Six Steps
- Adapting the EPQ Plan for Your Project Route
- Using Your EPQ Timeline as Evidence Throughout the Log
- Common EPQ Planning Mistakes and How to Avoid Them
- What to Do Next
1. What an EPQ Gantt Chart Is and Why It Matters for AO1
An EPQ Gantt chart is a bar chart, usually built in a spreadsheet, with a first column listing task names and a top row showing the timescale in weeks. Each horizontal bar sits against its task row and reflects a start date, a duration, and an end date. That structure makes it the visual core of your EPQ project plan and the natural home for your project timeline across all four boards: it sits inside the AQA Production Log and Assessment Record, the OCR Project Progression Record (PPR), the Pearson Edexcel activity log, and the planning section of WJEC's Candidate Assessment Record.
The non-obvious thing is what the chart earns on its own: very little. The marks for AO1 come from demonstrating that you managed the project, not merely that you drew a plan at the start. OCR moderators reviewing the Summer 2024 series noted that candidates who did well "made and justified changes to their plans". A chart with every bar untouched from week one to submission is weak evidence that anything was managed. The same report flagged that "at least some aims should relate to the steps needed to achieve planned outcomes", which means the tasks on your chart must connect directly to what you said you were trying to achieve, not just describe generic study habits.
AO1 is labelled "Manage" on every board, and the marks available differ by specification:
| Board | Specification | AO1 marks | Total marks |
|---|---|---|---|
| AQA | 7993 | 10 | 50 |
| OCR | H857 | 12 | 60 |
| Pearson Edexcel | ZPJ30 | 9 | 54 |
| WJEC | Level 3 Extended Project | 20 (LO1 + LO2) | 100 |
All four boards share the same four assessment objectives: AO1 Manage, AO2 Use resources, AO3 Develop and realise, AO4 Review (WJEC calls it 'Review and Communicate'). Your Gantt chart is primarily AO1 evidence, but because it tracks the research and production phases it feeds indirectly into how well you can narrate AO2 and AO3 in your log.
The practical takeaway: treat the chart as a living document, not a one-off diagram. Schedule a fortnightly check-in with yourself, move any bar that has slipped, and write one sentence in your log explaining why. That habit is what AO1 actually rewards.
2. The Seven Phases Every EPQ Project Plan Needs
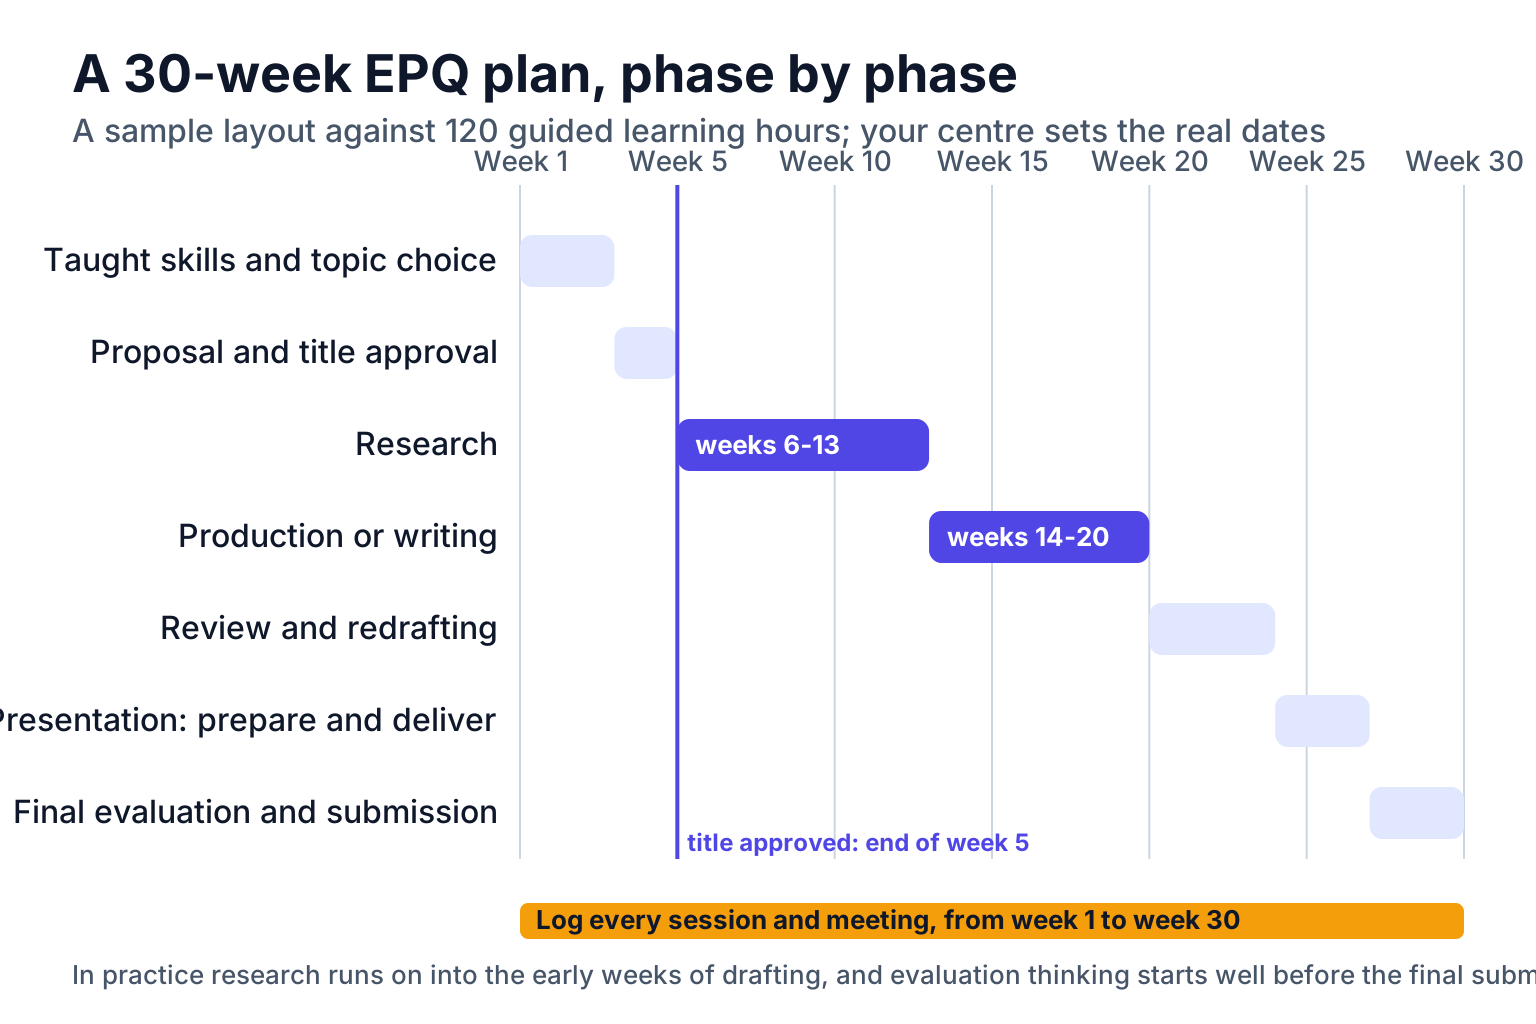
Every EPQ project, regardless of board or route, moves through the same seven phases. Getting the order right matters more than it might seem.
The phases in order:
- Taught skills and topic choice
- Proposal and title approval
- Research (secondary sources first, then any primary)
- Production or writing
- Review and redrafting
- Presentation preparation and delivery
- Final evaluation and submission
Why the order is not optional
Title approval is a hard milestone gate, not a formality. OCR's H857 specification states that project titles must be approved by centres, and centres must not supply titles or themes to learners. Any substantial research or writing done before your title is approved risks being wasted if the centre asks you to refocus. Treat approval as the point at which the clock genuinely starts on phases 3 and 4.
The phases are not always strictly sequential. Research commonly continues into the early weeks of drafting, and evaluation thinking should begin well before the final submission, not arrive as a last-minute addition.
A sample 30-week layout (written for this guide, not an exam-board exemplar)
All boards set the total at 120 guided learning hours (AQA 7993, OCR H857). The table below shows one way to distribute those hours across 30 weeks. Your centre's calendar determines the real dates.
| Phase | Weeks | Share of time |
|---|---|---|
| 1. Taught skills and topic choice | 1-3 | ~10% |
| 2. Proposal and title approval | 4-5 | ~7% |
| 3. Research | 6-13 | ~27% |
| 4. Production or writing | 14-20 | ~23% |
| 5. Review and redrafting | 21-24 | ~13% |
| 6. Presentation preparation and delivery | 25-27 | ~10% |
| 7. Final evaluation and submission | 28-30 | ~10% |
The value of mapping this against 120 hours is that it forces you to distribute effort deliberately. Projects that skip a written phase breakdown almost always overrun on research and compress drafting into the final few weeks, which shows in the quality of both the product and the log.
When building your EPQ project plan, mark title approval (end of week 5 in this layout) as a milestone on the chart. Everything before it is groundwork; everything after it is billable time on your main objectives.
3. How to Build Your EPQ Gantt Chart in Six Steps
Building an EPQ Gantt chart takes about an hour upfront and saves considerably more than that later. The chart can be built in any spreadsheet by shading cells to represent bars, or drawn on paper using a ruler and pencil. No specific software is required.
Column structure to use across every row:
| Column | Contents |
|---|---|
| 1 | Phase and task name |
| 2 | Estimated hours |
| 3 to N | One column per week, bar shaded for active weeks |
| Final | Actual vs planned note (date completed + one-line reason if late) |
Work through the six steps below in order.
Step 1 - List every task. Break each of the seven phases into specific, doable tasks. "Research" is not a task; "read and annotate five secondary sources on X" is. Aim for 15-25 tasks total. Keeping tasks small enough to complete in a single sitting makes it obvious when something is slipping.
Step 2 - Estimate hours. The EPQ totals 120 guided learning hours, which includes the taught element (OCR's specification, for example, splits it into 30 taught and 90 independent hours). Write an hour estimate next to every task and check that the column adds up to roughly the independent share your centre allows. This makes your use of time visible and is concrete planning evidence for AO1 (Manage).
Step 3 - Set dependencies. Some tasks cannot start until another is finished. Data analysis cannot begin before data collection is complete; writing cannot begin in earnest before a title is approved. Mark these as linked bars so a slip in one task immediately flags its knock-on effect.
Step 4 - Add milestones. Milestones are single points, not bars. Mark title approval, ethics sign-off for investigations, first draft complete, and presentation date. These fixed points anchor the rest of the chart and give your supervisor clear checkpoints.
Step 5 - Add a review column. The final column carries the actual completion date and a brief note when a task ran late or was moved. This is where the chart becomes evidence rather than decoration. A plan with no review column shows planning; a plan with a completed review column shows management.
Step 6 - Update fortnightly. Each update is a log entry. Record every change in your AQA Production Log and Assessment Record, OCR Project Progression Record (PPR), or Pearson activity log, with a brief justification for why the bar moved. The EPQ Gantt chart earns you nothing sitting unchanged from week one to submission day.
4. Adapting the EPQ Plan for Your Project Route
The three main routes across the boards are dissertation or report, artefact, and investigation. OCR H857 also recognises a performance or event as an outcome, and Pearson has a Performance unit (P303). The shape of a good EPQ project plan differs meaningfully between them, so your Gantt chart should reflect the route you have chosen rather than a one-size layout.
Dissertation or report
Research and drafting bars should be the longest on the chart. AQA specifies approximately 5,000 words for a solely research-based written report, and OCR similarly specifies approximately 5,000 words for a dissertation. That word count takes time to produce well, so plan your research phase to run well into the middle third of the project before the drafting bar begins. A common error is starting the draft too early and then discovering a gap in the secondary sources that forces a rewrite.
Artefact
Break the production phase into at least four bars: design, development, testing, and iteration. Do not treat these as sequential blocks that happen once. Testing will almost certainly feed back into development, so build a loop by adding a second short development bar after your first testing bar. AQA notes that photographs of each stage of artefact development may be submitted as evidence, so include a bar labelled "photograph and document stage" at each development checkpoint. The accompanying written report has a minimum of 1,000 words on both AQA and OCR. Budget time for that separately from the production work.
Investigation
Add a dedicated data-collection window as its own bar, and place a milestone for ethics approval immediately before it. Do not start collecting data until your supervisor has confirmed that your methods are appropriate and any centre ethics check is done. After collection closes, allow a distinct analysis phase before you move to writing. Students who compress analysis into the writing phase often find their argument lacks structure.
Performance or event (OCR)
OCR H857 recognises performance or event as a project outcome. Plan a rehearsal or event-planning bar that runs alongside your written work, and keep the 1,000-word minimum written piece on a separate bar so it does not get crowded out by preparation in the final weeks.
Evaluation: the bar that closes every route
Whichever route you take, the final evaluation bar on your chart carries weight beyond ticking a box. AO4 (Review) asks you to assess how the project went against the original plan. A Gantt chart that shows where bars moved, and a log that records why, gives you concrete material for that evaluation. The question to answer at the end is not just "did I finish?" but "how closely did the finished work match what I proposed, and what changed along the way?"
5. Using Your EPQ Timeline as Evidence Throughout the Log
A chart submitted once at the start of the Production Log and never mentioned again earns almost nothing for AO1. The marks come from what happens after you draw the chart: recording that you monitored progress, noticed when tasks drifted, made deliberate changes, and explained why. The AQA EPQ specification lists a "note of any changes made to plan and reasons for the changes" as a required element of the Production Log. That phrase matters: reasons, not just changes.
The OCR Summer 2024 moderators' report is specific on what separated stronger candidates: they "made and justified changes to their plans." The justification is the evidence. A bar that moves silently proves nothing. A bar that moves with a dated log entry explaining that a primary source became unavailable, or that illness compressed a research window, demonstrates exactly the kind of active project management AO1 rewards.
Practical steps to make the chart work as evidence:
- Save a dated copy of the chart each time you make a significant change. A simple filename convention such as `ganttv2november` or `ganttv3january` keeps versions traceable without any specialist software.
- In the relevant log entry, paste or reference the snapshot and write one or two sentences recording what shifted and why. Acceptable reasons include illness, a source that turned out to be inaccessible, a scope reduction after supervisor feedback, or a methodology change.
- Keep the original version. You will need it for the evaluation.
Using the chart in the evaluation and presentation:
The evaluation section should refer back to your original EPQ Gantt chart and compare it to the final version. The differences are not embarrassing: they are the evidence. Discussing what moved and what stayed on schedule shows self-awareness about your own project management, which is precisely what AO4 asks for.
In the presentation, a single slide showing the original timeline alongside the final one gives a non-specialist audience a clear visual account of how the project developed. The AQA specification requires the presentation to be delivered to a non-specialist audience using appropriate media, so this kind of before-and-after visual does practical work in that context.
The counter-intuitive point here: a Gantt chart that looks identical from start to finish may actually raise questions, because almost no real project runs exactly to its first plan. Showing zero changes can look like the log was not kept in real time.
6. Common EPQ Planning Mistakes and How to Avoid Them
Five patterns show up repeatedly in EPQ projects that underperform on the management objective. Each one is fixable before you submit.
Mistake 1: All aims are skills-development aims. The OCR Summer 2024 moderators' report says: "It is acceptable for some aims to relate to skills development, but some should also relate to the steps which need to be taken to achieve planned outcomes." An aim like "I will improve my research skills" describes personal growth; it does not map to a task bar on your chart. Write at least some aims as outcomes: "complete and evaluate five secondary sources by week eight."
Mistake 2: Bars labelled 'Research' for eight weeks. A single wide bar tells the assessor nothing about what you actually did. Break research into named tasks: find secondary sources, evaluate and annotate sources, build a research table, draft the literature review. Each becomes its own, shorter bar.
Mistake 3: No milestones. Without fixed points, such as title approval or first full draft, there is no reference against which to judge progress. Milestones give your log entries something concrete to report on.
Mistake 4: No review column and no log entries referencing the chart. A chart that was drawn once and never updated is a plan, not project management. The OCR report notes that candidates who did well "made and justified changes to their plans." That justification lives in the log.
Mistake 5: Underestimating redrafting time. Students routinely compress the review and redraft phase. Build at least three to four weeks explicitly for this after the first full draft, separate from your initial writing bars.
One practical note on software: the OCR Summer 2024 report observed that a greater number of centres used online project management apps in 2024 than in previous years. The board does not require any specific tool. A paper grid or a spreadsheet is equally valid evidence, provided it is updated and referenced in your log.
7. What to Do Next
The first version of your EPQ Gantt chart does not need to be polished. It needs to exist, because a chart you can monitor and annotate is worth far more to your AO1 mark than a perfect-looking plan you drew once and never touched again. Every bar you move, and every reason you record in your log for moving it, is evidence of the kind of reflective project management the assessment objectives reward.
This week, ask your supervisor for your centre's internal deadline calendar. Centres set their own submission dates, and your title approval meeting, first draft hand-in, and presentation slot all sit at fixed points in that calendar. Once you have those dates, you can anchor the sample 30-week layout described in section 2 to real weeks and draw your first bars with confidence.
Start on paper if a spreadsheet feels like a barrier. Get something down. Then update it.
FAQ
How do I make an EPQ Gantt chart?
List all your project tasks, estimate the hours for each against your 120 guided learning hours, set dependencies between tasks, mark milestones such as title approval and first draft, then shade cells in a spreadsheet - or draw bars on paper - to show each task's start date, duration, and end date; add a review column and update it at least every fortnight.
What does an EPQ Gantt chart look like?
A typical EPQ Gantt chart has a first column listing task names (grouped by phase), a second column showing estimated hours, weekly date columns across the top with shaded bars indicating each task's duration, and a final column for actual versus planned notes.
Can I use an EPQ Gantt chart as evidence for AO1?
Yes, but only when it shows monitoring - the chart must be updated when plans change, with reasons recorded in your log (AQA Production Log and Assessment Record, OCR PPR, or Pearson activity log); a static chart submitted once at the start of your project provides little AO1 evidence.
How many weeks should an EPQ project plan cover?
The total time for an EPQ is 120 guided learning hours; how many calendar weeks that covers depends on your centre's timetable (OCR's specification says the EPQ can be taught at any time during Years 12 or 13). The sample layout in this guide uses 30 weeks for illustration only - your supervisor or centre coordinator will confirm the actual dates.
Do all EPQ exam boards require a Gantt chart?
No board mandates a Gantt chart specifically - AQA requires an 'initial idea and outline plan' in the Production Log and Assessment Record, OCR requires a Project Progression Record (PPR), Pearson requires a project proposal form and activity log, and WJEC's Candidate Assessment Record has a 'Stage 1 - Planning Your Project' section - but a Gantt chart is a widely used way to provide that planning evidence.
How is EPQ project planning marked?
Project planning is assessed under AO1 (Manage), which is worth 10 out of 50 marks on AQA 7993, 12 out of 60 marks on OCR H857, 9 out of 54 marks on Pearson Edexcel ZPJ30 and 20 out of 100 on WJEC (learning outcomes 1 and 2); the marks reward evidence of planning, monitoring, and justified changes - not the chart's visual appearance.
References
- Cambridge OCR Extended Project H857 Moderators' report - Summer 2024 - https://www.ocr.org.uk/Images/727849-moderators-report.pdf
- AQA Level 3 Extended Project Qualification (7993) Specification v1.4 - 2.5.1 Assessment evidence and project product - https://filestore.aqa.org.uk/subjects/AQA-W-7993-SP-19.PDF
- Cambridge OCR Level 3 Extended Project Qualification H857 Specification v2.2 (October 2026) - Assessment, PPR, marking criteria bands, overlap with other qualifications - https://www.ocr.org.uk/Images/414382-specification.pdf
- Pearson Edexcel Level 3 Extended Project (ZPJ30) Specification Issue 4 - Assessment objectives, the presentation, assessment evidence - https://qualifications.pearson.com/content/dam/pdf/Project-Qualification/Level-3/2010/Specification/project-specification-level-3.pdf