Medicine Interview Rates: Applications to Offers by School
By Michael Thompson · Education Specialist; 10 years teaching the IB at Bromsgrove School · Published 26 October 2026 · Updated 28 October 2026
Medicine interview rates vary widely: UK medical schools interview between 14% and 95% of the applications they receive, and the interview-to-offer ratio, the success rate once you are in the room, runs from 14% to 88%. This page puts the published figures for 32 schools side by side, most selective first, from each school's admissions page or its freedom of information response, with the cycle each figure covers and what makes the rates differ.
Key Takeaways
- 14% to 95% interviewed: Keele at the bottom, Liverpool at the top.
- The interview decides a lot: between 14% and 88% of interviewees get an offer.
- Applications, not people: each applicant has four medicine choices, so every school's figures count them more than once.
In This Article
- Medicine interview rates at a glance
- Interview and offer rates by medical school, most selective first
- The counts behind the rates
- Schools without published figures
- What shapes the interview rate
- How this page was built
- What to do next
1. Medicine interview rates at a glance
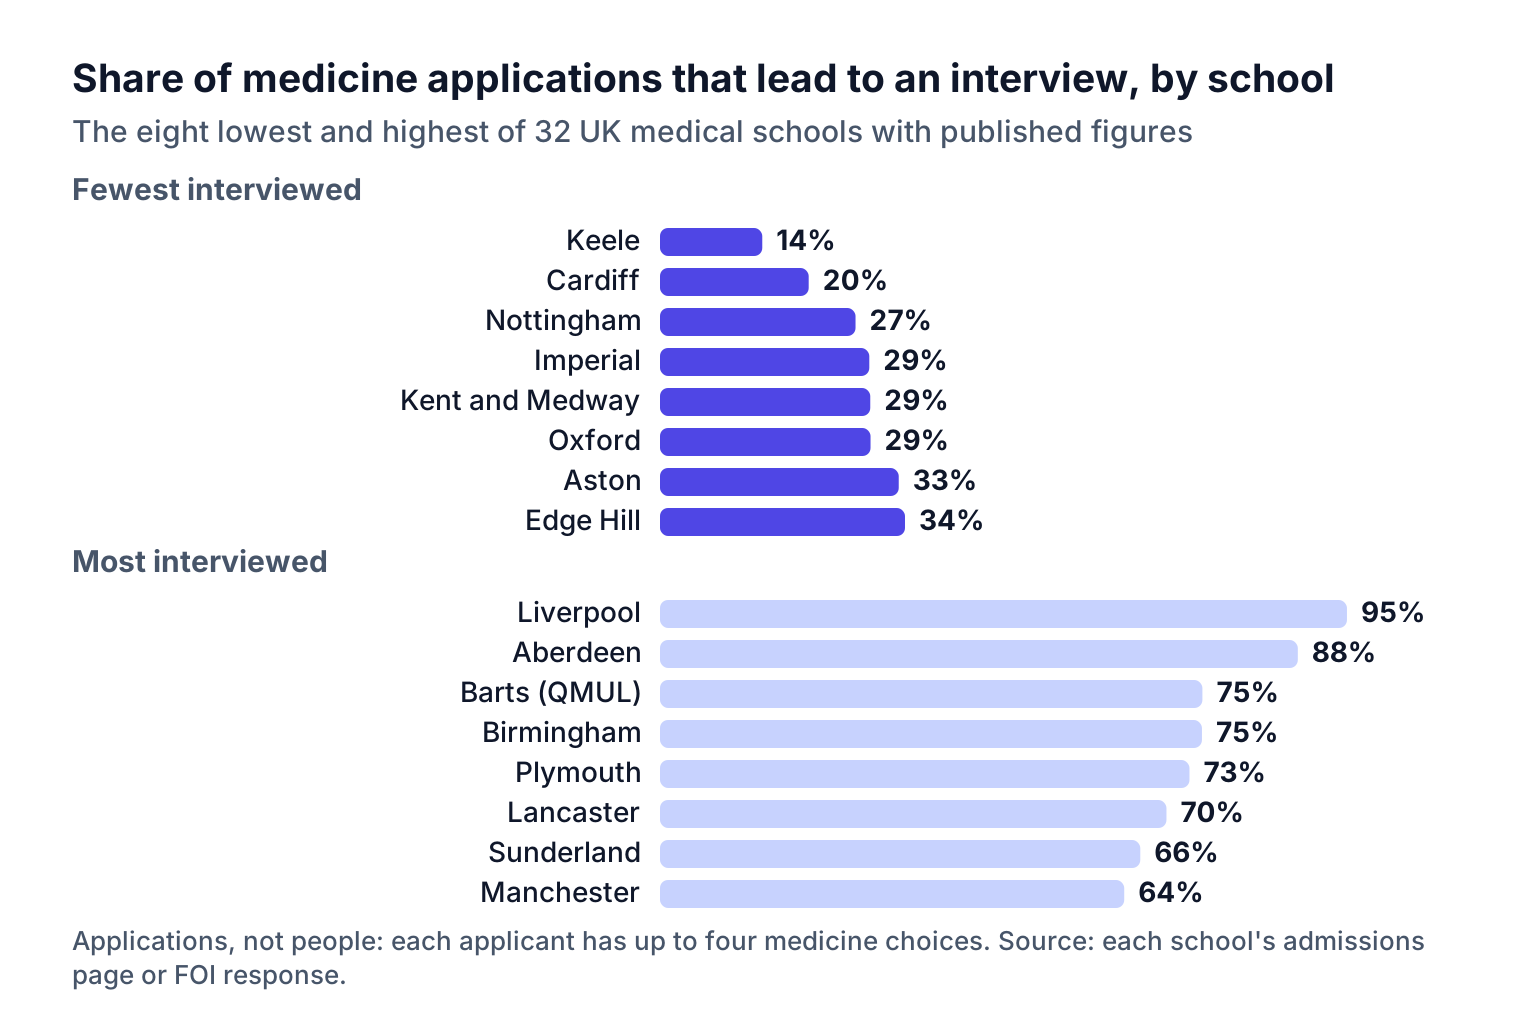
Thirty-two UK medical schools publish, or have released under freedom of information, how many applicants they interview. The share runs from 14% at Keele to 95% at Liverpool, and the difference is mostly how hard the UCAT cut is applied before anyone is seen. After the interview the odds are better: across the 27 schools that publish offers, between 14% and 88% of interviewees receive an offer.
One caution before the table: these are counts of applications to each school, not of people. Every applicant can apply to four medical schools, so a school's applications include people who were interviewed and accepted elsewhere.
2. Interview and offer rates by medical school, most selective first
"Interviewed" is the share of applications that led to an interview; "offered" is the share of interviewees who received an offer. The cycle column links the school's own figures or its freedom of information response.
Five schools' latest released figures are from 2023 entry or earlier (Keele, Imperial, Edge Hill, Exeter and Bristol), so read them as a guide, not the current cycle. Where the cycle column says Home applicants, the rate is for Home applications only.
3. The counts behind the rates
| Medical school | Applications | Interviewed | Offers |
|---|---|---|---|
| Keele | 2,449 | 345 | 133 |
| Cardiff | 3,911 | 801 | 639 |
| Nottingham | 2,833 | 763 | not stated |
| Imperial | 3,382 | 975 | 637 |
| Kent and Medway | 1,647 | 477 | 350 |
| Aston | 1,262 | 415 | 353 |
| Edge Hill | 323 | 109 | 15 |
| Exeter | 1,777 | 654 | 442 |
| King's | 2,960 | 1,200 | not stated |
| Leeds | 1,998 | 860 | 464 |
| Dundee | 1,951 | 844 | 570 |
| Brunel | 1,052 | 460 | not stated |
| Edinburgh | 1,909 | 839 | 585 |
| St Andrews | 1,371 | 649 | not stated |
| Brighton and Sussex | 1,637 | 824 | 673 |
| Sheffield | 1,967 | 1,040 | 742 |
| Hull York | 1,625 | 904 | 796 |
| Glasgow | 2,001 | 1,128 | 719 |
| UCL | 1,496 | 862 | 594 |
| City St George's | 1,279 | 773 | 369 |
| Bristol | 1,465 | 889 | 636 |
| Leicester | 2,622 | 1,638 | 869 |
| Southampton | 1,309 | 834 | 574 |
| Manchester | 2,607 | 1,667 | 985 |
| Sunderland | 1,105 | 731 | 353 |
| Lancaster | 959 | 669 | 451 |
| Plymouth | 931 | 679 | 419 |
| Birmingham | 1,633 | 1,219 | 985 |
| Barts (QMUL) | 1,732 | 1,294 | 991 |
| Aberdeen | 955 | 839 | 643 |
| Liverpool | 1,897 | 1,795 | 661 |
| Cambridge | 1,530 | not stated | 307 |
| Newcastle | not stated | 961 | 686 |
| Queen's Belfast | 1,511 | not stated | not stated |
Where a school publishes a rate rather than counts, it is missing from this table and appears in the first.
4. Schools without published figures
Ten medical schools interview but have no interview counts that we could find, published or released under freedom of information: Anglia Ruskin, Bangor (North Wales), Buckingham, East Anglia, Greater Manchester, Hertfordshire, Lancashire (UCLan), Lincoln, St Mary's Twickenham and Swansea. Cambridge released applications (1,530) and offers (307) for 2025 entry but not interviews, so its share interviewed cannot be computed. Newcastle released interviews (961) and offers (686) for 2025 but not applications; 71% of its interviewees were offered a place. Queen's Belfast released applications (1,511) for 2023/2024 but not interviews, so its share interviewed cannot be computed. Their course pages say how they shortlist, usually the UCAT with academic minimums, and that is the best guide to your chance of an invitation.
5. What shapes the interview rate
- The UCAT threshold. Schools that rank every eligible applicant on the UCAT and invite from the top, as UCL describes, interview a share set by how many places they have; schools that interview everyone above a fixed score, or weight GCSEs and the personal statement, can interview more.
- Contextual and widening-participation routes. Most schools invite eligible contextual applicants on different criteria, which raises the share interviewed without changing the standard route.
- Offers per interviewee. Sixteen of the 27 schools that publish offers make an offer to two in three or more of the people they see; Edge Hill offers to 14% and Liverpool offers to 37%. The second number is the one that tells you what the interview itself decides.
The page on medicine interview dates by school gives each school's dates and format, and the guide to how to get into medicine in the UK covers the UCAT, the four-choice rule and the MMI.
6. How this page was built
Applications, interviews and offers come from each medical school's own admissions page where it publishes them, and otherwise from the school's response to a freedom of information request published on WhatDoTheyKnow, linked in the table for each row; the cycle column says which year. Rates are the school's own where it publishes one, otherwise interviewed divided by applications and offers divided by interviewed, from the published counts. Graduate-entry routes are left out. Each page was read on 18 October 2026 and the figures were exported on 21 October 2026; nothing on this page is estimated, and where a university does not publish a figure the page says so. Universities change interview arrangements between cycles, so treat the course page you are applying to as the final word and this page as the way to compare courses side by side.
7. What to do next
Find your four schools in the table and compare the two numbers for each: a low share interviewed means the UCAT and academic screening did most of the selecting, so an invitation is already a strong result; a high share means the interview decides more, and the format on medicine interview dates by school is what to prepare for. Then practise the format each school uses, out loud and timed, because an MMI station gives you a few minutes and no second attempt. The hub page on Oxbridge and medicine interviews 2026 links every interview page on this site.
FAQ
What percentage of medicine applicants get an interview?
It depends on the school: from 14% of applications at Keele to 95% at Liverpool, with the UCAT threshold the main difference. The table on this page gives 32 schools.
What are the chances of an offer after a medicine interview?
Between 14% and 88% of interviewees receive an offer, depending on the school.
Which medical schools interview the fewest applicants?
Keele (14%), Cardiff (20%), Nottingham (27%) and Imperial (29%), on the most recent figures each publishes.
Where do medicine interview statistics come from?
From each school's own admissions page where it publishes them, and otherwise from freedom of information responses the schools have given, both linked from this page.
References
- Keele University: medicine admissions figures - https://www.whatdotheyknow.com/request/medicine_a100_statistics_2026
- Cardiff University: medicine admissions figures - https://www.whatdotheyknow.com/request/admission_statistics_for_medicin_58
- University of Nottingham: medicine admissions figures - https://www.whatdotheyknow.com/request/admissions_statistics_for_underg_36
- Imperial College London: medicine admissions figures - https://www.whatdotheyknow.com/request/medicine_course_a100_admission_s_6
- Kent and Medway Medical School: medicine admissions figures - https://www.whatdotheyknow.com/request/mbchb_medicine_admissions_statis_17
- University of Oxford: medicine admissions figures - https://www.ox.ac.uk/admissions/undergraduate/courses/course-listing/medicine
- Aston University: medicine admissions figures - https://www.whatdotheyknow.com/request/mbchb_medicine_admissions_statis
- Edge Hill University: medicine admissions figures - https://www.whatdotheyknow.com/request/admissions_statistics_a100_and_a_6
- University of Exeter: medicine admissions figures - https://www.whatdotheyknow.com/request/a100_medicine_statistics_2019248
- King's College London: medicine admissions figures - https://www.kcl.ac.uk/study/undergraduate/courses/medicine-mbbs
- University of Leeds: medicine admissions figures - https://www.whatdotheyknow.com/request/mbchb_medicine_admissions_statis_19
- University of Dundee: medicine admissions figures - https://www.dundee.ac.uk/corporate-information/medicine-admissions-statistics
- Brunel University of London: medicine admissions figures - https://www.whatdotheyknow.com/request/mbchb_medicine_admissions_statis_6
- University of Edinburgh: medicine admissions figures - https://medicine-vet-medicine.ed.ac.uk/sites/default/files/2025-10/MBChB%20Admissions%20Statistics%202025.pdf
- University of St Andrews: medicine admissions figures - https://www.st-andrews.ac.uk/medicine/prospective/admissions-data/
- Brighton and Sussex Medical School: medicine admissions figures - https://www.whatdotheyknow.com/request/mbchb_medicine_admissions_statis_5
- University of Sheffield: medicine admissions figures - https://www.whatdotheyknow.com/request/mbchb_medicine_admissions_statis_29
- Hull York Medical School: medicine admissions figures - https://www.hyms.ac.uk/medicine/applying/selection-procedure
- University of Glasgow: medicine admissions figures - https://www.gla.ac.uk/media/Media_1233096_smxx.pdf
- University College London: medicine admissions figures - https://www.whatdotheyknow.com/request/a100_medicine_admission_statisti_120
- City St George's, University of London: medicine admissions figures - https://www.citystgeorges.ac.uk/about/schools/health-sciences/about/admissions-statistics
- University of Bristol: medicine admissions figures - https://www.whatdotheyknow.com/request/medicine_a100_2054
- University of Leicester: medicine admissions figures - https://le.ac.uk/-/media/uol/docs/academic-departments/medicine/study/applying/a100-a199-admissions-statistics-2026-entry---offers.pdf
- University of Southampton: medicine admissions figures - https://www.whatdotheyknow.com/request/southampton_medical_school_a100
- University of Manchester: medicine admissions figures - https://www.bmh.manchester.ac.uk/study/medicine/apply/data/
- University of Sunderland: medicine admissions figures - https://www.whatdotheyknow.com/request/mbchb_medicine_admissions_statis_31
- Lancaster University: medicine admissions figures - https://www.lancaster.ac.uk/lms/medicine-and-surgery/admissions-data/
- University of Plymouth: medicine admissions figures - https://www.plymouth.ac.uk/courses/undergraduate/bmbs-bachelor-of-medicine-bachelor-of-surgery/entry-requirements
- University of Birmingham: medicine admissions figures - https://www.birmingham.ac.uk/documents/college-mds/medical-school/mbchb-admissions-statistics-sept-2026.pdf
- Queen Mary University of London: medicine admissions figures - https://www.qmul.ac.uk/fmd/study/undergraduate/courses/admissions-statistics-for-medicine--dentistry/
- University of Aberdeen: medicine admissions figures - https://www.abdn.ac.uk/smmsn/undergraduate/medicine/admissions-data/
- University of Liverpool: medicine admissions figures - https://www.whatdotheyknow.com/request/mbchb_medicine_admissions_statis_22