Oxford Interview Rates by Course: Who Gets Shortlisted
By Michael Thompson · Education Specialist; 10 years teaching the IB at Bromsgrove School · Published 26 October 2026 · Updated 28 October 2026
Oxford interviews between 18% and 95% of applicants depending on the course, and offers a place to between 19% and 52% of those it interviews. This page puts the University's own admissions statistics for every course side by side, most selective first, adds the share of interviewees who get an offer, gives the full application, interview and offer counts for the departments that publish them, and says what makes the rates differ.
Key Takeaways
- 18% to 95% interviewed: Economics and Management at the bottom, Classics, Classics and Modern Languages, and Modern Languages and Linguistics at the top.
- The test decides: courses with an admissions test interview 34% of applicants on average; those without, 72%.
- Mostly three-year averages: 2023 to 2025 entry on the course pages; the Mathematical Institute and the Department of Computer Science also publish last cycle's counts for five courses.
In This Article
- Oxford interview rates at a glance
- Interview rate by course, most selective first
- The departments that publish full counts
- What shapes the interview rate
- How this page was built
- What to do next
1. Oxford interview rates at a glance
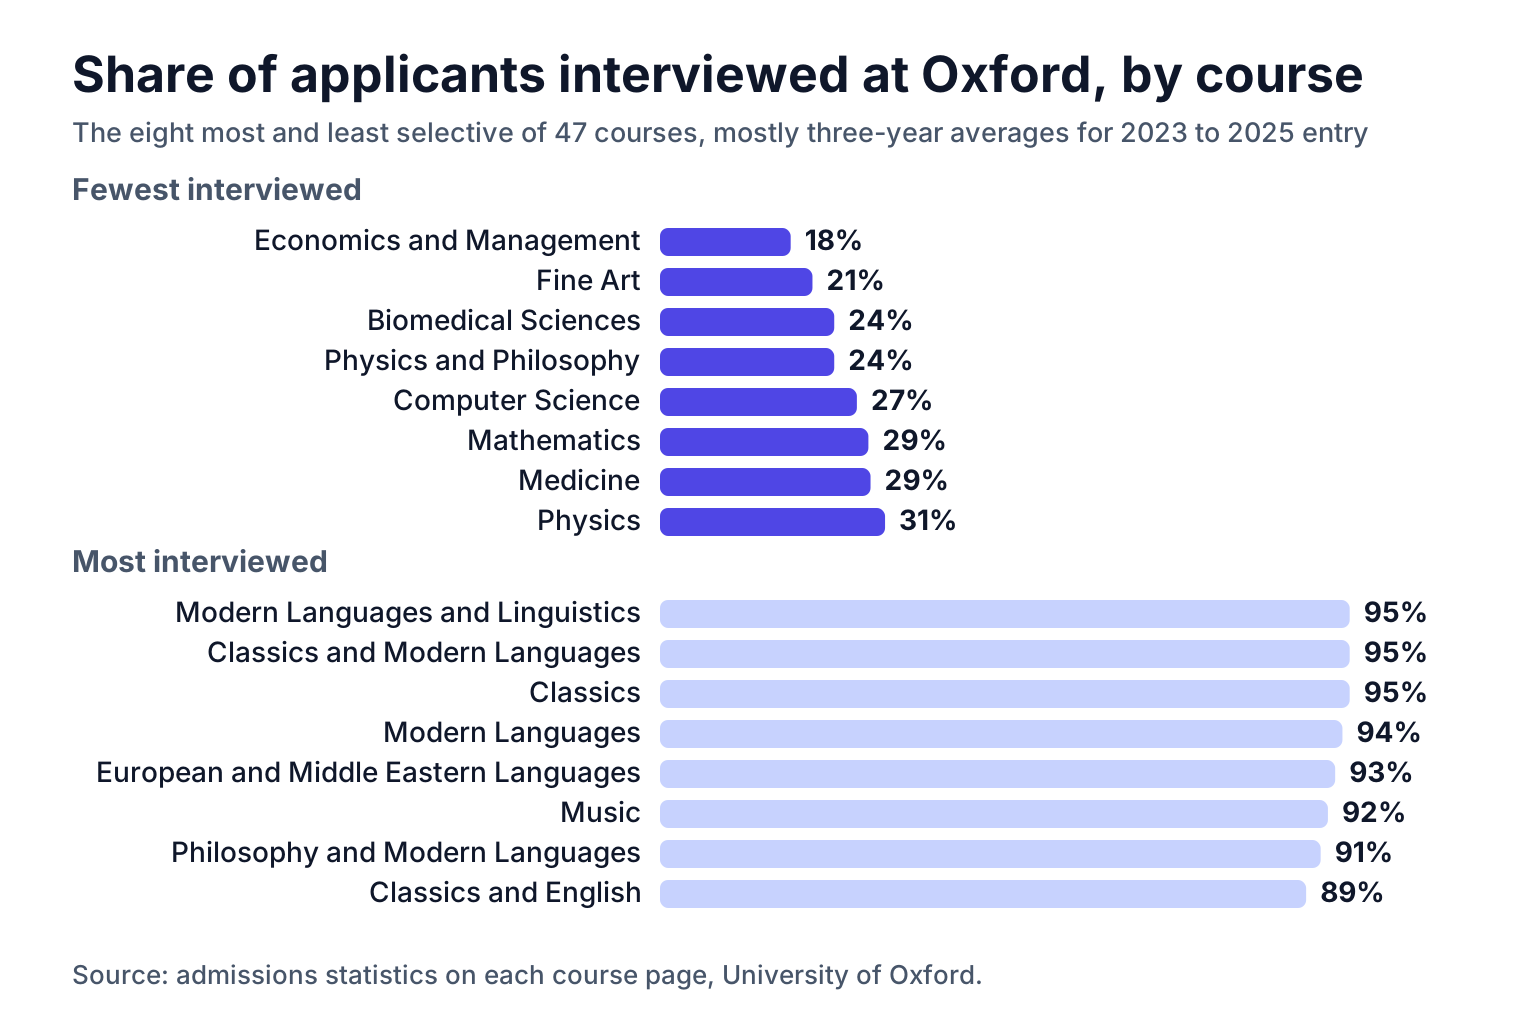
Oxford publishes, for almost every course, two figures as shares of all applicants: "interviewed" and "successful" (offered a place), usually as a three-year average; the Mathematics and Computer Science courses give last cycle's counts instead. Dividing the second by the first gives the share of interviewees who received an offer, which is the figure this page adds. The spread is wide: Economics and Management interviews 18% of applicants while Classics, Classics and Modern Languages, and Modern Languages and Linguistics interview 95%. The difference is mostly the admissions test: the 19 courses that shortlist on a test interview 34% of applicants on average, the 28 without one 72%.
Once you are interviewed the odds narrow, and the interview-to-offer ratio is the number to watch: across the 45 courses with both figures, the share of interviewees offered a place runs from 19% to 52%, with 33% the median, so an interview is where most of the selection happens. Oxford's own "successful" figure, the acceptance rate by course, is lower, because it counts every applicant.
2. Interview rate by course, most selective first
"Interviewed" is the share of all applicants who were called to interview, as Oxford publishes it. "Offered a place" is the share of all applicants who received an offer, Oxford's "successful" figure, computed here from the two published percentages (so a point out at most). "Per interviewee" divides the second by the first. Places is the typical intake. The figures column links the department report where a course publishes one.
| Course | Interviewed | Offered a place | Per interviewee | Places | Figures |
|---|---|---|---|---|---|
| Economics and Management | 18% | 5% | 28% | 82 | 2023-25 average |
| Fine Art | 21% | 11% | 52% | 28 | 2023-25 average |
| Biomedical Sciences | 24% | 8% | 33% | 45 | 2023-25 average |
| Physics and Philosophy | 24% | 9% | 38% | 13 | 2023-25 average |
| Computer Science | 27% | 11% | 40% | 55 | 2025-26 cycle |
| Mathematics / Mathematics and Statistics | 29% | 10% | 35% | 183 | 2025-26 cycle |
| Medicine | 29% | not stated | not stated | 155 | 2023-25 average |
| Physics | 31% | 11% | 36% | 173 | 2023-25 average |
| Law (Jurisprudence) | 31% | 10% | 32% | 187 | 2023-25 average |
| Mathematics and Philosophy | 33% | 10% | 30% | 18 | 2025-26 cycle |
| Psychology (Experimental) | 34% | 12% | 35% | 49 | 2023-25 average |
| Mathematics and Computer Science | 37% | 16% | 44% | 59 | 2025-26 cycle |
| Psychology, Philosophy and Linguistics | 37% | 14% | 38% | 37 | 2023-25 average |
| Engineering Science | 37% | 15% | 41% | 174 | 2023-25 average |
| Philosophy, Politics and Economics (PPE) | 38% | 12% | 32% | 227 | 2023-25 average |
| Computer Science and Philosophy | 39% | 13% | 33% | 14 | 2025-26 cycle |
| Medicine (graduate-entry / accelerated) | 41% | not stated | not stated | 35 | 2023-25 average |
| Biochemistry (Molecular and Cellular) | 41% | 12% | 29% | 100 | 2023-25 average |
| History and Politics | 41% | 13% | 32% | 46 | 2023-25 average |
| History and Economics | 43% | 12% | 28% | 17 | 2023-25 average |
| Philosophy and Theology | 43% | 17% | 40% | 25 | 2023-25 average |
| Religion and Asian and Middle Eastern Studies | 45% | 15% | 33% | 2 | 2023-25 average |
| Biology | 46% | 15% | 33% | 112 | 2023-25 average |
| History of Art | 49% | 14% | 29% | 14 | 2023-25 average |
| Human Sciences | 56% | 16% | 29% | 28 | 2023-25 average |
| History and English | 57% | 12% | 21% | 12 | 2023-25 average |
| Archaeology and Anthropology | 58% | 16% | 28% | 19 | 2023-25 average |
| Materials Science | 62% | 22% | 36% | 43 | not stated |
| Chemistry | 63% | 17% | 27% | 180 | 2023-25 average |
| Theology and Religion | 65% | 32% | 49% | 40 | 2023-25 average |
| English Language and Literature | 67% | 22% | 33% | 208 | 2023-25 average |
| History (Ancient and Modern) | 71% | 23% | 32% | 24 | 2023-25 average |
| History | 74% | 23% | 31% | 215 | 2023-25 average |
| Geography | 75% | 22% | 29% | 76 | 2023-25 average |
| Earth Sciences (Geology) | 83% | 20% | 24% | 35 | 2023-25 average |
| History and Modern Languages | 84% | 25% | 30% | 19 | 2023-25 average |
| Asian and Middle Eastern Studies | 85% | 32% | 38% | 36 | 2023-25 average |
| English and Modern Languages | 86% | 31% | 36% | 30 | 2023-25 average |
| Classical Archaeology and Ancient History | 88% | 17% | 19% | 24 | 2023-25 average |
| Classics and English | 89% | 24% | 27% | 13 | 2023-25 average |
| Philosophy and Modern Languages | 91% | 36% | 40% | 19 | 2023-25 average |
| Music | 92% | 42% | 46% | 77 | 2023-25 average |
| European and Middle Eastern Languages | 93% | 40% | 43% | 13 | 2023-25 average |
| Modern Languages | 94% | 44% | 47% | 141 | 2023-25 average |
| Classics | 95% | 33% | 35% | 104 | 2023-25 average |
| Classics and Modern Languages | 95% | 39% | 41% | 8 | 2023-25 average |
| Modern Languages and Linguistics | 95% | 39% | 41% | 38 | 2023-25 average |
3. The departments that publish full counts
Five courses go further than a percentage: the Mathematical Institute and the Department of Computer Science publish the applications, interviews and offers for the latest cycle.
| Course | Applications | Interviewed | Offers | Places | Cycle |
|---|---|---|---|---|---|
| Mathematics / Mathematics and Statistics | 2,052 | 589 | 208 | 183 | 2025-26 cycle |
| Computer Science | 531 | 144 | 58 | 55 | 2025-26 cycle |
| Mathematics and Computer Science | 564 | 206 | 90 | 59 | 2025-26 cycle |
| Mathematics and Philosophy | 169 | 56 | 17 | 18 | 2025-26 cycle |
| Computer Science and Philosophy | 118 | 46 | 15 | 14 | 2025-26 cycle |
These are the only courses where the figures are a single year rather than an average, so they move more from year to year.
4. What shapes the interview rate
- The admissions test. Courses that shortlist on a test interview a smaller share, because the test does the first cut: the lowest rates sit on Economics and Management (18%), Biomedical Sciences (24%), Physics and Philosophy (24%), and Computer Science (27%). Courses without a test, such as the languages and Classics, interview most applicants and make the decision in the room.
- Places. A small course can interview a large share and still make few offers: Classics and Modern Languages (eight places, 95% interviewed), European and Middle Eastern Languages (13 places, 93% interviewed), Philosophy and Modern Languages (19 places, 91% interviewed), and Classics and English (13 places, 89% interviewed) each take 20 places or fewer.
- The year. Most figures are three-year averages for 2023 to 2025 entry; the five courses with department reports are a single cycle and move more.
The rate tells you how far an application gets on paper; it says nothing about how the interview itself goes, and what an Oxford interview is like is the page for that.
5. How this page was built
The shares interviewed and offered a place, and the places, come from the admissions statistics box on each course's page in the University of Oxford's undergraduate course listing, given there as shares of all applicants and as a three-year average for 2023 to 2025 entry; the share per interviewee is the second divided by the first; the full counts come from the department reports linked in the tables. Materials Science gives its rates without saying which years they cover. Each page was read on 18 October 2026 and the figures were exported on 21 October 2026; nothing on this page is estimated, and where a university does not publish a figure the page says so. Universities change interview arrangements between cycles, so treat the course page you are applying to as the final word and this page as the way to compare courses side by side.
6. What to do next
Find your course in the first table and read the two numbers together: a low interview rate means the admissions test did most of the shortlisting, so an invitation is already a strong result; a high one means the interview decides more of the outcome. Then look at Oxford interview dates for when it happens and what an Oxford interview is like for what you will be asked to do. For what to practise in the weeks before, see how to prepare for an Oxford interview.
FAQ
How many people get an Oxford interview?
It depends on the course: from 18% for Economics and Management to 95% for Classics, Classics and Modern Languages, and Modern Languages and Linguistics, as three-year averages on Oxford's course pages. Courses with an admissions test interview fewer applicants.
What are the chances of an offer after an Oxford interview?
Between 19% and 52% of interviewees receive an offer, depending on the course, and 33% on the median course. The table on this page gives the figure for each one.
Which Oxford courses interview the fewest applicants?
Economics and Management (18%), Fine Art (21%), Biomedical Sciences (24%), and Physics and Philosophy (24%). Three of the four shortlist on an admissions test; Fine Art shortlists on the portfolio.
Does getting an Oxford interview mean you will get an offer?
No. Between 19% and 52% of interviewees receive an offer, 33% on the median course, so the interview is where most of the selection happens.
References
- University of Oxford: Computer Science and Philosophy admissions report - https://www.cs.ox.ac.uk/admissions/undergraduate/admissions_statistics/feedback2025.pdf
- University of Oxford: Mathematics and Philosophy admissions report - https://www.maths.ox.ac.uk/system/files/inline-files/Feedback%202025.pdf
- University of Oxford: undergraduate course listing - https://www.ox.ac.uk/admissions/undergraduate/courses/course-listing