Cambridge Interview Rate and Offers by Course, 2025 Cycle
By Michael Thompson · Education Specialist; 10 years teaching the IB at Bromsgrove School · Published 26 October 2026 · Updated 28 October 2026
Cambridge does not publish an interview rate by course, so this page gives the figure it does publish. Cambridge made 4,893 offers to 22,513 applicants across 32 courses in the 2025 cycle, 22% overall, with the rate by course running from 9% to 67%. The University's published applications, offers and places are side by side below for every course, most selective first, with what Cambridge does not publish made plain.
Key Takeaways
- 22% of applicants get an offer: 4,893 offers from 22,513 applications in the 2025 cycle.
- 9% to 67% by course: Computer Science at the bottom, Classics (4-year course) at the top.
- Interview counts are not published: five course pages give a share in their own words; the rest say shortlisted applicants without a figure.
In This Article
- The Cambridge interview rate: what is published
- Offers per applicant by course, most selective first
- What the figures do and do not tell you
- How this page was built
- What to do next
1. The Cambridge interview rate: what is published
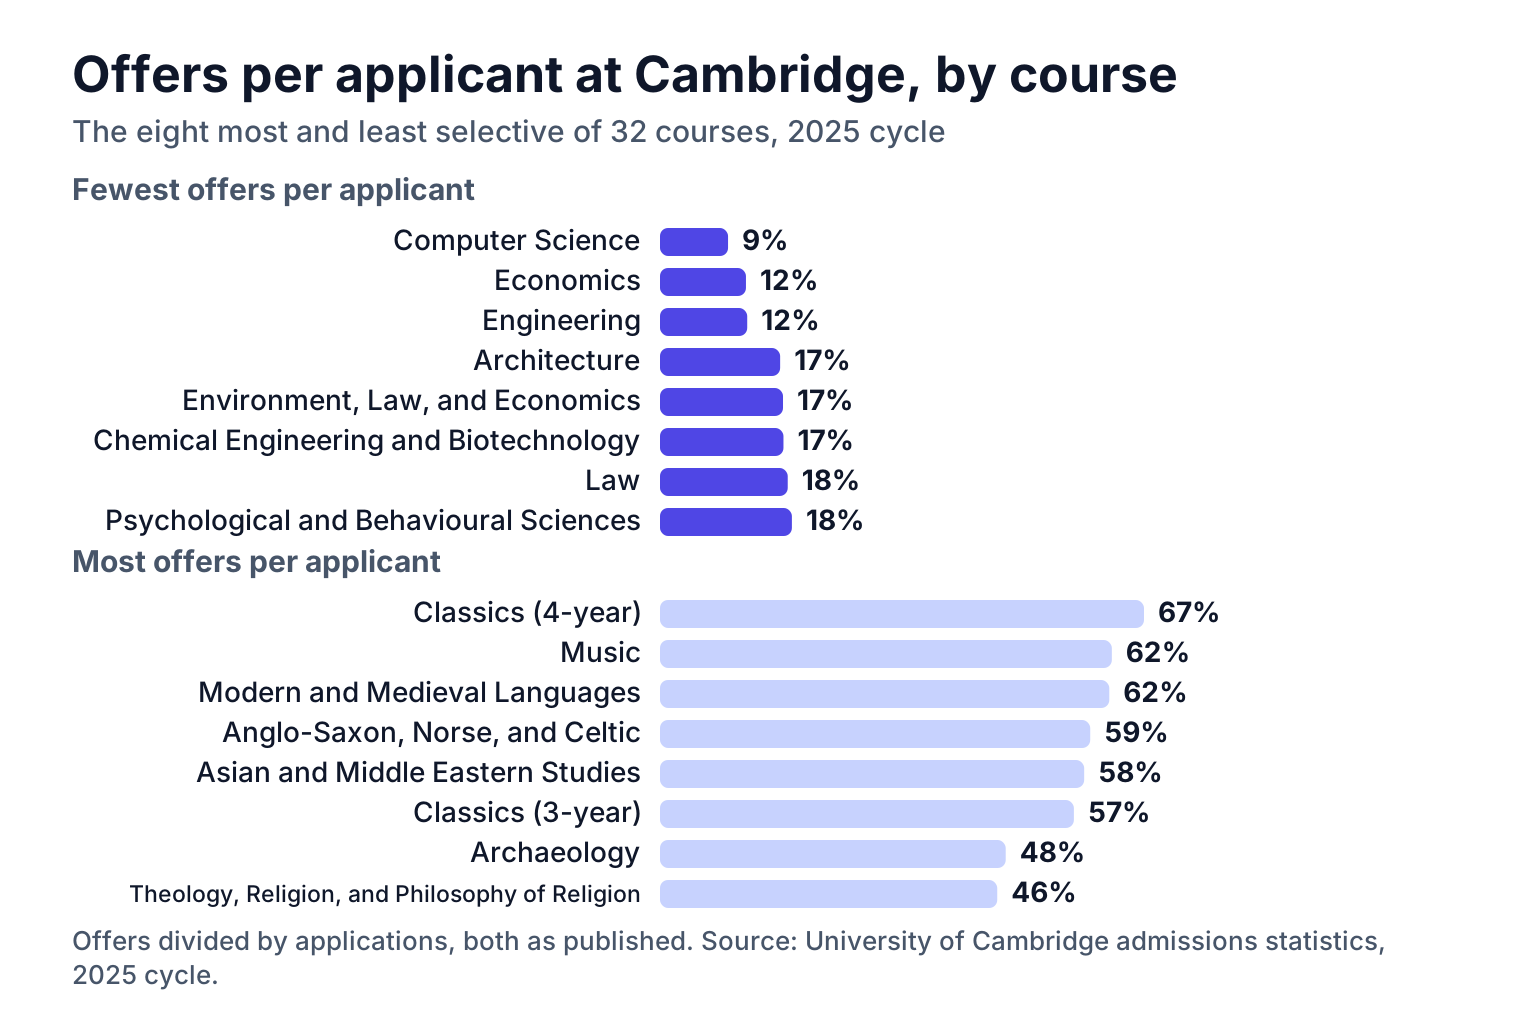
Cambridge does not publish an interview rate for most courses; five course pages give a share in their own words: Psychological and Behavioural Sciences (about two thirds of applicants), Veterinary Medicine (more than half or more than 70% of applicants, the page gives both), Mathematics (over 80% invited in recent years), Human, Social, and Political Sciences (around 75% of applicants), and Theology, Religion, and Philosophy of Religion (approximately 80% of applicants). What it publishes for every course, in its annual admissions statistics, is applications, offers and acceptances, so the figure you can compare across courses is offers per applicant: across the 32 courses with figures, 4,893 offers were made to 22,513 applicants in the 2025 cycle, 22% overall. The range runs from 9% for Computer Science to 67% for Classics (4-year course).
Cambridge interviews most applicants, so the offer rate per applicant understates the rate per interviewee by less than it would at Oxford; the published shares above are the only hard figures.
2. Offers per applicant by course, most selective first
"Offers per 100 applicants" is offers divided by applications, both as published; it is not an interview rate. Places is the number who took up a place.
Linguistics and Modern Languages has no separate row in the statistics.
3. What the figures do and do not tell you
- They are one cycle. The 2025 cycle means applications from September 2024 for entry in October 2025 or deferred to 2026. Oxford's equivalent figures are three-year averages, so the two universities' numbers are not directly comparable.
- Interview counts are not published per course. Treat the offer rate as a rough guide to the rate per interviewee, and the course page as the only source for whether you will be shortlisted.
- Small courses swing. Ten courses had fewer than 150 applicants, from Anglo-Saxon, Norse, and Celtic (54) to Design (148), so a dozen offers moves their rate by several points.
4. How this page was built
Applications, offers and places for every course come from the University of Cambridge's undergraduate admissions statistics for the 2025 cycle, published in May 2026; the shares interviewed, where given, come from the course pages in the undergraduate course directory. Each page was read on 18 October 2026 and the figures were exported on 21 October 2026; nothing on this page is estimated, and where a university does not publish a figure the page says so. Universities change interview arrangements between cycles, so treat the course page you are applying to as the final word and this page as the way to compare courses side by side.
5. What to do next
Find your course in the table and read the offers-per-applicant figure as the size of the field you are in, not as your odds: your own chance depends on what you do at interview, where what a Cambridge interview is like tells you what to expect and Cambridge interview dates when. Then practise the conversation itself; the guide to how to prepare for a Cambridge interview covers how. the mistakes Oxbridge interviewers see most sets out what tutors notice.
FAQ
What percentage of Cambridge applicants get an interview?
Cambridge does not publish interview counts by course; Psychological and Behavioural Sciences (about two thirds of applicants), Veterinary Medicine (more than half or more than 70% of applicants, the page gives both), Mathematics (over 80% invited in recent years), Human, Social, and Political Sciences (around 75% of applicants), and Theology, Religion, and Philosophy of Religion (approximately 80% of applicants) give a share on the course page. It interviews most applicants, so the share of interviewees offered a place is higher than the offer rate per applicant on this page.
What is the Cambridge offer rate by course?
From 9% for Computer Science to 67% for Classics (4-year course) in the 2025 cycle, 22% overall. The table on this page gives every course.
Which Cambridge courses are the most competitive?
By offers per applicant in the 2025 cycle: Computer Science (9%), Economics (12%), Engineering (12%) and Architecture (17%).
Are Cambridge offer rates comparable with Oxford's?
Not directly. Cambridge publishes one cycle's applications and offers; Oxford publishes three-year averages of the share interviewed and the share of interviewees offered a place.
References
- University of Cambridge: undergraduate admissions statistics, 2025 cycle - https://www.undergraduate.study.cam.ac.uk/sites/default/files/2026-05/ug_admissions_statistics_2025_cycle.pdf
- University of Cambridge: undergraduate courses - https://www.undergraduate.study.cam.ac.uk/courses