University League Tables Explained: How to Read Them
By Michael Thompson · Former IB Diploma Programme coordinator; 10 years at Bromsgrove School · Published 5 July 2026
University league tables are one of the first things prospective students check - and one of the most misread. Each of the main UK rankings measures a different mix of factors, so the same university can sit 10 places higher in one table than another without either being wrong. This guide explains what the tables actually measure, why they diverge, and how to use them as one input rather than a verdict. The more useful question is rarely 'which university ranks highest overall?' and almost always 'which department ranks highest for my subject?'
Key Takeaways
- Each table uses a different formula: The Complete University Guide, The Guardian, and the Times/Sunday Times Good University Guide all weight entry standards, student satisfaction, graduate prospects, research quality, and spending differently - so rankings vary across them.
- Subject-level tables beat overall tables: A university ranked outside the top 20 overall can lead its subject table - Loughborough, for instance, tops global subject rankings in sports-related fields despite sitting well outside the QS overall top 200.
- Small rank gaps are noise: A difference of five or ten places between two universities on the same table usually falls within the margin of variation in the underlying data, not a meaningful quality gap.
- Entry standards are often quoted in A-level terms: IB Diploma applicants should treat the entry-standards metric as a rough guide and check directly with each university for how it expresses its IB offer.
- Overall rank can diverge sharply from subject rank: Cambridge ranked first overall in the Complete University Guide 2026 but fell to fourth for Politics in the same edition - always cross-check your subject.
- League tables are a starting point: Course content, teaching style, location, and funding opportunities are not captured by any table; use rankings to build a shortlist, then investigate those factors directly.
In This Article
- What Are University League Tables
- What University League Tables Actually Measure
- Why the Various League Tables Give Different Results
- Subject League Tables Matter More Than Overall Rankings
- How IB Students Should Read Entry Requirements vs Ranking Data
- Where League Tables for University Can Mislead You
- How to Use University League Tables Alongside Course Fit
- What to Do Next
1. What Are University League Tables
University league tables are ranked lists of UK universities compiled by independent publishers, using data drawn from sources such as the Higher Education Statistics Agency (HESA) and the National Student Survey (NSS). They are not produced by the government or any single regulator, which matters more than most applicants realise: each publisher chooses its own metrics and weightings, so the same university can sit in noticeably different positions depending on which table you read.
The three main domestic tables are the Complete University Guide, The Guardian University Guide, and the Times/Sunday Times Good University Guide. The Complete University Guide has been compiling rankings for nearly 30 years, with free online access since 2007. The Guardian tables are compiled by independent consultancy Intelligent Metrix using HESA and NSS data.
Global tables also exist, most notably the QS World University Rankings and the Times Higher Education World University Rankings. These use different criteria, weighted heavily toward research output, international reputation, and citations, which means a university can rank very highly worldwide while sitting mid-table domestically, or vice versa. For most undergraduate applicants in the UK, the domestic tables are the more relevant starting point.
2. What University League Tables Actually Measure
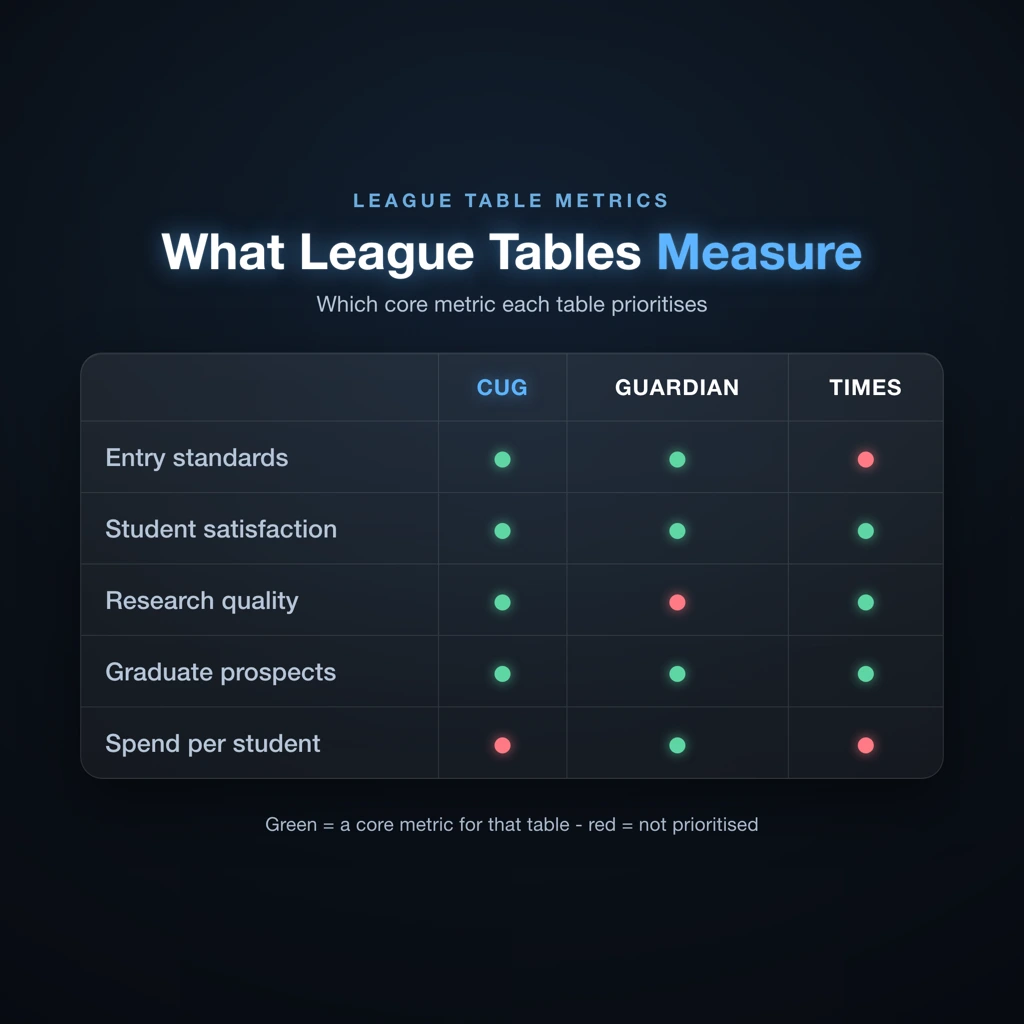
University league tables rank institutions by combining several measurable metrics, each drawn from national data sources. The core metrics used across the main tables are:
- Entry standards - the average UCAS Tariff points of students actually enrolled, not the published minimum offer.
- Student satisfaction - drawn from the National Student Survey (NSS), which asks final-year undergraduates to rate teaching, feedback, and course organisation.
- Research quality - typically derived from the Research Excellence Framework (REF), which grades the quality of academic output submitted by each institution.
- Graduate prospects - the proportion of graduates in graduate-level employment or further study, usually 15 months after finishing.
- Spend per student - the institution's expenditure on academic services and facilities divided by student headcount, used as a rough proxy for resource quality.
The non-obvious quirk: entry standards measure who got in, not how well they were taught. A university that admits only high-tariff students will score well on this metric regardless of what happens once those students arrive.
Each table weights these metrics differently, which is why the same university can sit in markedly different positions across various league tables. The Guardian tables, for instance, are compiled using data from the Higher Education Statistics Agency (HESA) and the NSS. The Complete University Guide has compiled rankings for nearly 30 years and assesses institutions on entry standards, student satisfaction, research quality, and graduate prospects. The Times Higher Education World University Rankings are based on analysis of almost 19 million research papers and 1.5 million survey responses.
| Table | Key metrics prioritised | Main data sources | Distinguishing feature |
|---|---|---|---|
| Complete University Guide | Entry standards, graduate prospects, research quality, student satisfaction | HESA, NSS, REF | Has published freely available rankings online since 2007 |
| The Guardian | Student satisfaction, spend per student, graduate prospects, entry standards | HESA, NSS | Introduced a continuation metric measuring the risk of a student not completing their course |
| Times/Sunday Times | Teaching quality, research, graduate outcomes, student experience | HESA, NSS, REF | Combines student experience survey with NSS data |
| QS / THE (global) | Research reputation, citations, international diversity, employer reputation | Academic surveys, Scopus citation data | Heavily weighted toward research output and global reputation |
The continuation metric introduced by the Guardian is worth noting specifically. It penalises universities where a higher proportion of students drop out, which can shift the reading position in the league table for institutions with strong research reputations but weaker retention records.
3. Why the Various League Tables Give Different Results
Different tables measure different things, so divergence between them is normal rather than a sign that one is wrong.
A concrete example shows how quickly positions shift. In the Complete University Guide 2026, Cambridge ranks first overall in the UK, yet fell to fourth for Politics in the same guide. Oxford sits second overall but claimed the top Politics spot, climbing two places from 2025. The same guide, the same year, opposite conclusions depending on whether you look at the overall ranking or the subject table.
Across different publishers the divergence comes from weighting choices. The Guardian weights student-facing indicators, including satisfaction scores, staff-to-student ratios, and spending per student, more heavily than research output. A university with strong research metrics may therefore rank higher in THE or QS but sit lower in the Guardian University Guide, where those metrics carry less weight. Cambridge, for instance, ranks third overall in the Guardian guide but third in the Times Higher Education World University Rankings too - the positions happen to coincide, but for different reasons.
The less obvious point: a gap of five or ten places on any single table is usually within the noise of data collection. Underlying figures like satisfaction scores are rounded before they reach the table compilers, and small differences in survey response rates can shift a position by several places without reflecting any real difference in teaching quality. Treat a ten-place gap as a rough signal, not a precise verdict.
4. Subject League Tables Matter More Than Overall Rankings
The overall institutional rank tells you how a university performs across everything it does. If you are applying to study one subject, that number is almost beside the point.
**The subject-level table is the more actionable reference**, because it measures the department you will actually attend. An overall rank averages performance across dozens of departments, which means strong departments can be buried and weak ones inflated.
The Loughborough example makes this concrete. Loughborough University ranks first in the world for sports-related subjects in the QS subject rankings, yet does not appear in the QS overall top 200. A student scanning the general table would miss it entirely. Similarly, the Royal College of Art ranks first globally for art and design, and the Bartlett School of Architecture (part of UCL) ranks first globally for architecture in QS subject rankings. Neither institution would catch your eye in a general table scan.
The non-obvious trade-off here: specialist institutions often outscore large research universities at subject level precisely because they concentrate resources on fewer disciplines. A general table rewards breadth. A subject table rewards depth.
Practical steps to apply this:
- Identify the subject-specific QS ranking, the Complete University Guide subject table, and the Guardian subject table for your intended course.
- Cross-check at least two of those tables, since methodology differs and a single table can produce outliers.
- Treat the overall institutional rank as background context, not the primary filter.
Your reading position in a league table only becomes meaningful once you are looking at the right table.
5. How IB Students Should Read Entry Requirements vs Ranking Data
The entry-standards column in UK league tables is almost always expressed in A-level grades or UCAS tariff points. For IB Diploma Programme students, this makes the column useful as a rough signal of selectivity, not a precise admissions threshold. A university sitting near the top of that metric is competitive; one near the bottom is less so. That much is reliable. The actual IB points offer it will make you is a separate question entirely.
Go directly to each university's admissions pages to find how it phrases its IB requirement. Two universities with near-identical A-level entry-standards scores may quote meaningfully different IB totals, and the league table figure gives you no way to see that gap. The conversion is not mechanical.
One counter-intuitive quirk worth knowing: some universities specify IB subject-level requirements (for example, a minimum grade in a Higher Level science) that are more restrictive than the headline points total suggests. A 36-point offer with HL Chemistry 6 can be harder to meet than a 38-point offer with no subject conditions. The entry-standards column captures none of this.
Finally, keep entry requirements and ranking as separate variables. A course that fits your IB profile at a mid-table university may have stronger departmental resource in that specific subject than a higher-ranked institution where the department is small. Reading position in a league table tells you about the university overall, not the course you will actually attend.
6. Where League Tables for University Can Mislead You
An overall rank is a weighted average across every subject an institution offers. A university sitting in the top 20 nationally might have a genuinely strong law school and a mediocre computer science department. The single number obscures both. Subject tables, by contrast, rank departments directly, which is why the same institution can appear in very different positions depending on which table you check.
Four specific blind spots are worth knowing:
- Overall rank hides internal variation. A mid-table university might lead its subject table for nursing or education while ranking poorly in engineering. Reading position in a league table at the institutional level tells you nothing about the specific course you are applying to.
- Tables ignore what they cannot measure. Course content, assessment style (exams versus coursework), pastoral support, campus culture, and location are absent from every major ranking. These factors are not trivial, and for some students they outweigh a ten-place rank difference.
- Graduate prospects metrics are blunt. Most tables measure employment or further study at around six months after graduation. They do not distinguish between a graduate-level role and an unrelated stopgap job, and they say nothing about earnings at five or ten years out.
- Research quality is not teaching quality. The Research Excellence Framework (REF) scores that feed into some tables measure a university's research output, not what happens in its lecture rooms. A department full of active researchers can still deliver inconsistent undergraduate teaching, and the correlation is weaker than the ranking implies.
The practical upshot: use league tables for university as one data point, not a verdict.
7. How to Use University League Tables Alongside Course Fit
University league tables work best as a filter, not a verdict. A practical three-step approach:
- Build a longlist using the overall table. Use whichever broad ranking you find most readable to identify universities you had not already considered. This is triage, not selection.
- Switch to subject-level tables to filter that longlist. A university's overall position can mask strong or weak individual departments. Oxford's politics department scored 100 in the Guardian's subject rankings, nearly nine points ahead of Cambridge in the same table - but the overall institutional gap between those two is far smaller. Subject tables surface that kind of distinction.
- **Treat your shortlist as roughly equivalent and differentiate on course fit.** Read module specifications, check whether a placement year is available, and visit if you can.
A difference of a handful of places between two universities should not override concrete preferences about course structure, location, or cost. The numerical gap simply does not carry that precision.
One non-obvious point: reading position in the league table is only meaningful once you know what that table measures. A high Guardian score reflects student satisfaction and teaching input. A high Times Higher Education score reflects research prestige and citation volume. The same university can sit 15 places apart across the two tables and be completely consistent - the tables are measuring different things, not contradicting each other.
8. What to Do Next
This week, open the subject-level table for your intended course in both the Complete University Guide and the Guardian University Guide - both are free. Write down your shortlist from each. If the order shifts significantly, that divergence is worth investigating: it usually points to a difference in how each table weights graduate outcomes versus student satisfaction, and that trade-off is specific to your priorities, not a ranking error.
One non-obvious gotcha: a university that ranks highly overall can sit mid-table for a specific subject, and vice versa. Subject position is the number that matters for your application.
Browse and compare universities by subject ranking and region in our UK universities directory, then check whether your shortlist holds up across at least two tables before you finalise your choices.
FAQ
What do university league tables measure?
The main UK tables measure a combination of entry standards, student satisfaction, graduate prospects, research quality, and spend per student - but each table weights these factors differently, which is why rankings vary across publications.
Which university league table is most reliable?
No single table is definitively the most reliable; the Complete University Guide, The Guardian, and the Times/Sunday Times each use transparent methodologies, and cross-checking all three gives a more balanced picture than relying on one.
Do university league tables matter?
They matter as a starting point for building a shortlist, but subject-level tables are more useful than overall rankings for most applicants, and factors like course content and location are not captured by any table.
When do university league tables come out?
The main UK tables typically publish in late summer or autumn for the following academic year - The Guardian usually releases in September, while the Complete University Guide and Times/Sunday Times publish around the same period.
How are university league tables calculated?
Compilers collect data from sources such as HESA and the National Student Survey, assign scores to each metric, weight them according to their own formula, and sum the weighted scores to produce a rank.
Why does the same university rank differently in different league tables?
Because each table applies a different weighting to its metrics - a university with strong research output but average student satisfaction scores will rank higher in research-heavy tables like THE than in student-focused tables like The Guardian.
References
- Cambridge is UK number 1 in 2019 university rankings | Alumni - https://www.alumni.cam.ac.uk/news/cambridge-is-uk-number-1-in-2019-university-rankings
- Oxford tops league table for Politics in UK | DPIR - https://www.politics.ox.ac.uk/news/oxford-tops-league-table-politics-uk
- Oxford tops world university rankings for record 10th year - BBC News - https://www.bbc.co.uk/news/articles/c36k9kdkne9o
- Land Economy successes in 2026 university league tables | Department of Land Economy - https://www.landecon.cam.ac.uk/news/land-economy-successes-2026-university-league-tables
- UK global university ranking Brexit warning - BBC News - https://www.bbc.co.uk/news/business-47346798
- Oxford retains top spot for politics in The Guardian UK University rankings | DPIR - https://www.politics.ox.ac.uk/news/oxford-retains-top-spot-politics-guardian-uk-university-rankings